Presentation at ISWC2006 workshop on user interfaces. The pathetic fallacy is not on RDF per se, but on the efforts of showing/visualizing it as a graph...
Processing is an open source programming language and environment for people who want to program images, animation, and interactions. It is used by students, artists, designers, researchers, and hobbyists for learning, prototyping, and production. It is c
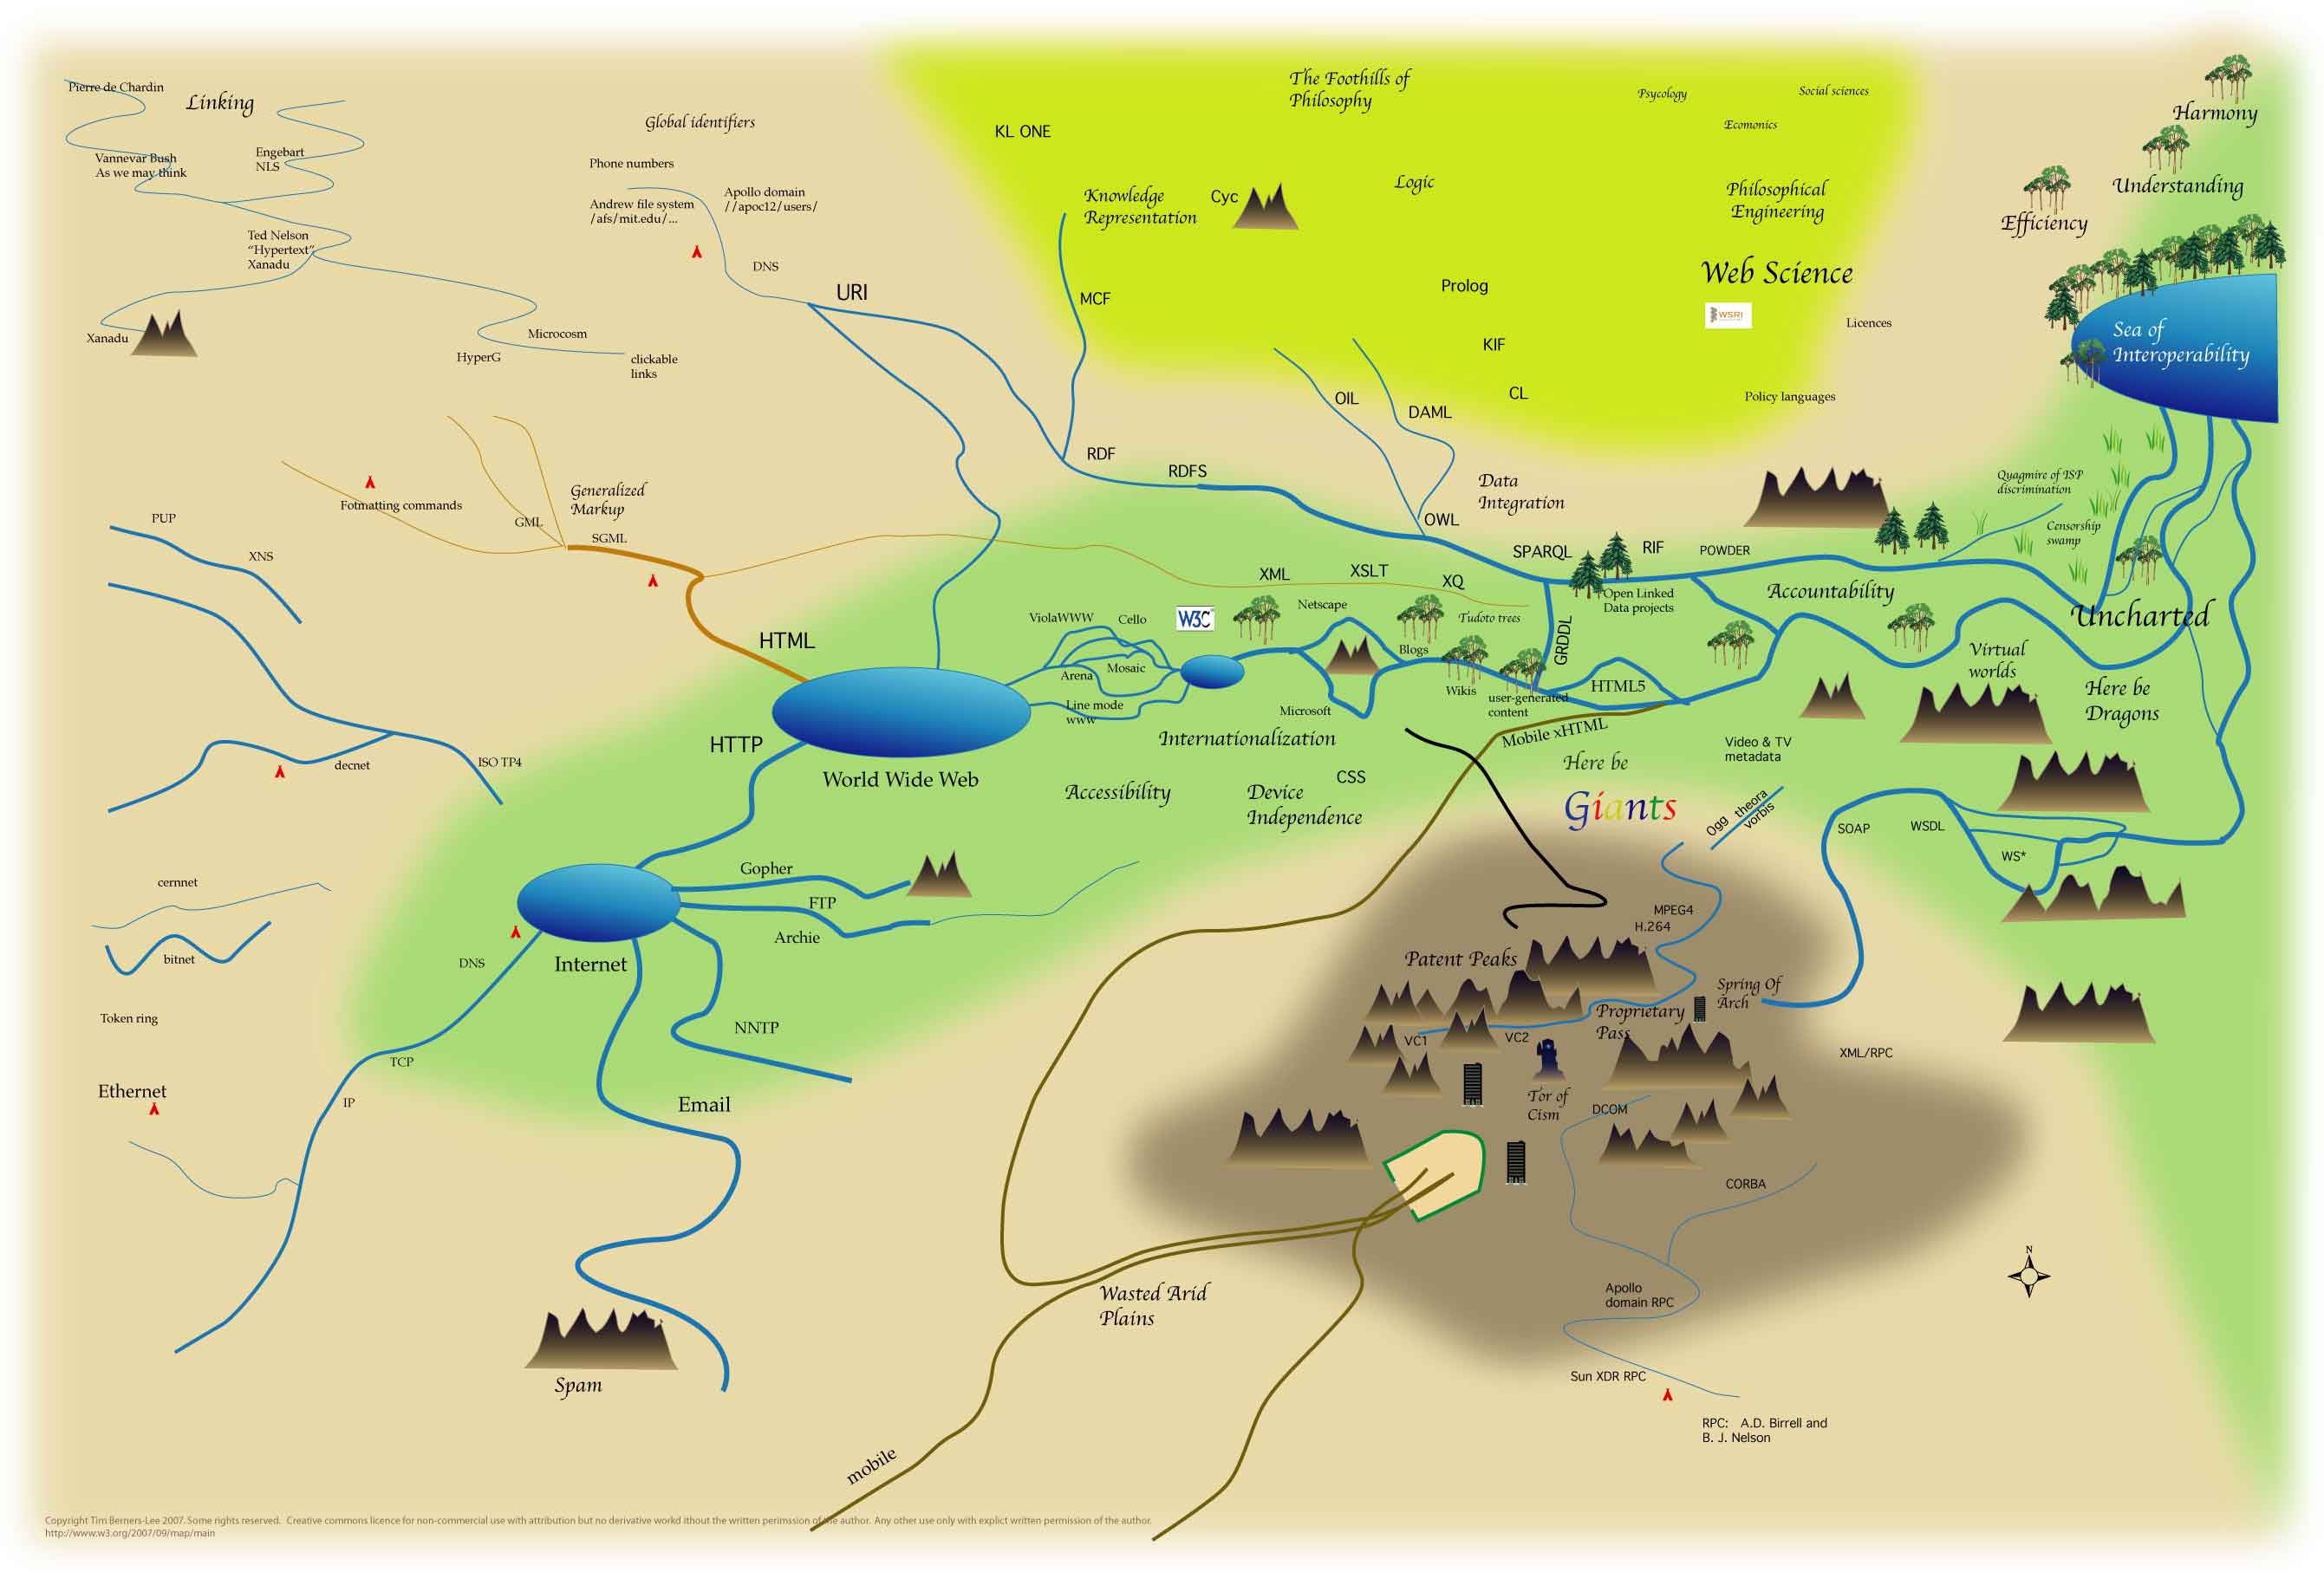
The fact that it is called a “web” suggests that there should be other ways of navigating websites, and there are a number of projects attempting to employ information visualizations and spatial maps to do so.
Data presentation can be beautiful, elegant and descriptive. There is a variety of conventional ways to visualize data - tables, histograms, pie charts and bar graphs are being used every day, in every project and on every possible occasion. However, to convey a message to your readers effectively, sometimes you need more than just a simple pie chart of your results. In fact, there are much better, profound, creative and absolutely fascinating ways to visualize data. Many of them might become ubiquitous in the next few years.
ordle is a toy for generating “word clouds” from text that you provide. The clouds give greater prominence to words that appear more frequently in the source text. You can tweak your clouds with different fonts, layouts, and color schemes. The images you create with Wordle are yours to use however you like. You can print them out, or save them to the Wordle gallery to share with your friends.
We create concept maps, a type of model, to explore and learn about complex information spaces. By showing everything—the forest and the trees—in a single view, concept maps help people create mental models and clarify thoughts. We create concept maps to share understanding— with our clients, peers, and others interested in the subjects. Please note: many of our concept maps are poster size. They can be printed at smaller sizes (11 x 17), but may be difficult to read. A few of the maps have been printed and are available through our office.
Q-tools The list below attempts to define a set of “Q-tools” that may be used to generate, sort, classify and perform operations on information. This is not intended to be an exhaustive list, but more of a starting point for discussion. I have also added some alternative names for each Q-tool. PrismA prism is a question that divides information into smaller groups. The purpose of a prism is to break down information into categories or subgroups. An example might be “What are the parts of this system?” Prisms are used extensively in scientific inquiry. They are also used in organization design to map the departments and sub-departments of a company. An example question used in this activity might be “What roles are required to deliver this functionality?” To create a prism, define a question that can be used to divide a unit of information into its constituent parts. Alternative names: Divider, separator, splitter, brancher.
Processing is an open source programming language and environment for people who want to program images, animation, and interactions. It is used by students, artists, designers, researchers, and hobbyists for learning, prototyping, and production. It is created to teach fundamentals of computer programming within a visual context and to serve as a software sketchbook and professional production tool. Processing is an alternative to proprietary software tools in the same domain. Processing is free to download and available for GNU/Linux, Mac OS X, and Windows.
A collection of screenshots encompassing some of the best, most beautiful looking Android apps.
Aiming to provide inspiration and insight into Android UI conventions.
Build website interactions and animations visually — without writing code. Add parallax scrolling effects, mouse based motion, and multi-step animations without learning CSS and JavaScript.
DensityDesign is a Research Lab of the Politecnico di Milano. It focuses on the visual representation of complex social, organizational and urban phenomena. www.densitydesign.org.
Looking for 3d Interior Rendering Company Abu Dhabi? Immerse yourself in the future of interior design with Al Baraka, 3d visualization interior design UAE. Contact us.